Posts

Showing posts from 2021

Another Yes Poll Plot

Image
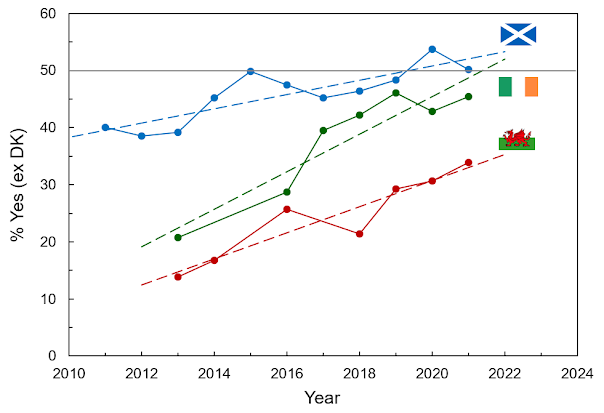
For this plot, I show the yearly average as per the methodology detailed here: https://skiersfirindy.blogspot.com/2021/08/oan-subject-of-yes-polling.html Updated with newer results here: https://skiersfirindy.blogspot.com/2021/08/oan-subject-of-yes-polling.html But this time I've added every single poll point that went into it, including today's IPSOS MORI. If you simply stick a linear trend through that, you get basically the same answer. Aye, excluding dinnae ken, has risen steadily from around 40% in 2011, to just over 50% today. Always look at the bigger picture.

Mass, Uncontrolled Emigration out of the UK & Long Term GDP Contraction

Image
Forgotten by most, the UK economy started contracting in Q3 2019 ahead of Britain's final departure from the EU (1 & 2). This was of course well before the covid pandemic, which didn't start to impact the UK economy until mid Q1 2020. As would be expected, the effect of the 2017 Leave vote was to cause GDP growth to slow, commensurate with skilled workers from the EU ceasing to come to live and work in the UK. This can be seen clearly in the data (3). While the pandemic has masked what has been happening GDP-wise, the trend will be as indicated in (2); the decline in this closely correlating with the depopulation trend (3). Never in the history of human civilisation has an economy grown in the face of mass depopulation, particularly of young, skilled workers. The UK is now entering a long term economic decline that could only be arrested if depopulation is stopped, and by popular free will / free movement. The UK government may soon act to prevent people leaving, e.g. by re

Population of the UK by country of birth and nationality: Year ending June 2021

Image
 The floods out of the UK exit gates continues apace. EU nationals living in the UK had fallen by 1/3 of a million since exit day. Meanwhile, the number of non-EU nationals has hardly changed in over a decade. Source: https://www.ons.gov.uk/peoplepopulationandcommunity/populationandmigration/internationalmigration/bulletins/ukpopulationbycountryofbirthandnationality/yearendingjune2021

This is Great Britain

Image
 

Scottish Free Choice Self Declared National Identity / Nationality as a Function of Year of Majority

Image
Graph of Scottish free choice self declared national identity / nationality as a function of year of majority (YoM) i.e. the year a person turned 18. Selected YoM with corresponding years of birth (b, in brackets) are shown. British identity in the Scottish population peaks in those born in 1944, i.e. the post war consensus baby boomers, these people turning 18 early in the swinging sixties (1962). Britishness then goes into continuous decline while Scottish (only) identity remains relatively stable in those who turned 18 in the intervening years until ~1997 onwards when it starts to rise measurably, with a corresponding acceleration in the decline of Britishness. This is the generation turning 18 in the year of the 1997 devolution referendum, i.e. ‘Thatcher’s children’, born in 1979. 2007 sees a huge surge in Scottish identity in new 18 year old voters. These are the young Scots coming of age under pro-independence devolved governments. These trends are fundamentally linked to the ~60

WoS Donation Data for 2019-2020

Image
Total (over the entire life of the site) stated donations as of: August 2019 https://archive.is/sH1OD#selection-743.0-747.50 ‘£900,000’ August 2020 https://archive.is/nQmQC#selection-1255.0-1255.31 £899,806 September 2021 https://archive.is/baeX7#selection-3455.0-3457.8 £884,841

The reason Scotland isn't independent yet but should be soon

Image
Naff all tae dae wi the SNP. You just can't hurry the process along. Only events such as brexit can do that.

Why natural gas can obviously reduce CO2 emissions massively compared to coal

Image
Natural gas is mostly (80-99%) methane. LNG (liquified natural gas) is nearly pure (99%+) methane.  A simple table tells us why we can reduce carbon emissions by over 70% by swapping from coal to methane, before we even consider the thermal output per mole. Methane is 80% 'clean' hydrogen, burning to mostly water, with some CO2. Methane is not 'carbon neutral', but it is only just behind hydrogen at burning to ~70% water instead of the ultimate 100% for hydrogen.

Latest data on mass emigration out of the UK

Image
Since the English nationalist fundamentalist conservatives swept to power in England in 2019, ending free movement for Scottish, Welsh English and European citizens the latter have started flooding out the UK exit gates. Brits however, are not so lucky; they are now largely trapped in a UK of racism, food, fuel and goods shortages.  What brits did not realise was that 'taking back control of our borders' meant trapping Brits inside . As can be seen in the data, there was never going to be any need for tougher controls on EU citizens coming to the UK. They are leaving in their hundreds of thousands all by themselves. All that was needed was to tell them 'You are not wanted here - go back to where you came from!' and they did, even while free movement was still in place (ended 31st December 2020).   ONS data show that net EU migration turned negative by 2017. At that point, the number of EU nationals in the UK began steadily declining. While the BBC tries to convince peo

Scottish independence long term polling 10th September 2021

Image
Update of plot to incorporate new polls to 10-09-2021: EDIT Presented to show chance of getting a Yes vote. Red = cat's chance in hell. Amber = mibbes aye, mibbes naw, maist likely naw. Yellae =  maist likely aye.   Also pandemic fun and games in 2020. Green = data suggest it may be a foregone conclusion.  Data from here: https://whatscotlandthinks.org/questions/how-would-you-vote-in-the-in-a-scottish-independence-referendum-if-held-now-ask/#line For explanation of methodology, see: https://skiersfirindy.blogspot.com/2021/08/oan-subject-of-yes-polling.html

2014 Yes Vote by Local Authority Area National Identity

Image
 Plot of % Yes in 2014 for different local authority areas based on the % of respective populations nationally self identifying as British, Scottish + British, English and Other UK (Census 2011). Unsurprisingly, the more British/other UK identifying a LA population was, the lower the Yes vote in 2014. Of course conversely, the more Scottish and less British/UKish an LA area is, the more it voted in favour of independence. 

SNP & Alba Large Donations Q1-Q2 2021

Image
All large donations* made to the SNP Q1-Q2 and Alba Q2 2021. "Political parties Political parties have to report donations and loans to us if they are above or aggregate to over: £7,500 to the central party (or over £1500 if the donor or lender gives further during the calendar year) £1,500 to accounting units (sections of a party whose finances aren’t managed directly by the party’s headquarters)" Alba: SNP: *Sources:  https://www.electoralcommission.org.uk/who-we-are-and-what-we-do/financial-reporting/annual-accounts https://www.electoralcommission.org.uk/who-we-are-and-what-we-do/financial-reporting/donations-and-loans

This is not a blog

It's just a repository for graphs and comments on these. People can freely use the graphs as they like for whatever purpose, but it would be nice that they link to the source page.

Welsh Independence Polling

Image
Support for independence in Wales has also been steadily rising, with the polling average for 2021 indicating 34% of Welsh people (expressing a view) now back the country leaving the UK.  Data is very limited*, but trend is consistent. Data for 2018 suggest a possible reduction in support following Wales voting narrowly for brexit alongside England. However, averages for 2019 onwards reverted to the rising Yes long term trend. By 2023 - the target year for Scotland's second independence referendum - linear projection suggests support for independence in Wales may have reached 38%. --- * https://en.wikipedia.org/wiki/Welsh_independence#Opinion_polling

Indy news site & blog visit statistics for August 2021

Image
A plot of selected well-known pro-independence site visit statistics from: www.similarweb.com . Note the different scales for sites to allow comparison of trends. As a country-wide news paper, the National has a readership one order of magnitude greater than popular blogs, so cannot practically be scaled with these without a loss of trend resolution.  A similar case applies for wingsoverscotland.com , where a comparison with the others must be treated with caution. Wings is unique in the group in that it is a UK-wide, English based site , with focus on Scotland, while the others are all Scottish sites. Statistically speaking, this means Wings has an ostensibly much larger audience base, i.e. that of the whole UK. At the same time, the site's anti-SNP / Scottish Green stance would also likewise be expected to draw in a significant unionist audience, contrasting the others, with the increasing exception of SGP, which has also become highly critical of the SNP recently.  While some re

Irish reunification long term polling trends

Image
I don't claim to be any expert on N. Ireland, apart from being a Irish National thanks to my Irish gran who was born in the North before it existed, i.e. pre-partition.  But then this is simply a statistical analysis of data, using the exactly the same procedure as for Scotland here: https://skiersfirindy.blogspot.com/2021/08/oan-subject-of-yes-polling.html With data sourced from here: https://en.wikipedia.org/wiki/United_Ireland#Opinion_polling Suffice to say while the dataset is small, the trend in NI seems very clear, with potential parallels to that of Scotland. Namely, there is a steadily rising Yes baseline with waverers on top responding to events to give occasional peaks; Brexit being the obvious one in the graph, with covid maybe giving people pause for thought? It seems the UK has very little time left. Baseline support for reunification may hit majority by as early as 2023.

SNP membership long term trends

Image
One of the classic unionist myths is that SNP membership is 'secret', and has supposedly 'collapsed', 'possibly to as low as 50,000', to quote some erm 'real independence supporters' commenting on the National. This is of course utter guff. The SNP publish data on their membership annually as part of the audited accounts submitted to the Electoral Commission*. It would be illegal to falsify membership data here, and illegal for Johnston Carmichael (the SNP's auditors) to knowingly sign that off. The latest data has just been released, and is the final point in the graph below. As can be seen, since the post 2014 surge, SNP membership has never fallen below 100k. In fact it steadily increased longer term to a peak in 2019-2020 (a recent peak for Yes in polls) before falling away due to covid. The main reason people gave for leaving during this period was apparently due to financial reasons associated with lost income during the pandemic, which seems p

Scottish independence long term polling August 2021

Image
Below is a plot of all independence Y/N polling data going back to 2011. For each year, an average has been taken of all polls from individual pollsters (from the what Scotland thinks website)*. These averages were then combined to give a single new average value for all, ensuring no specific pollster bias. In all years bar 2015, some form of mandate existed for an independence referendum, making that year slightly anomalous in the series; people were free to use Y/N polling as a 'protest', e.g. for more devolution, without fear it might prompt the Scottish Government to hold another vote. In terms of the overall data trend, it can be seen that the series is characterised by a decadal steady increase in support for independence which varies on the shorter term between a 'baseline' and 'upper bound'. The baseline can be assumed to be those that will always vote Yes 'tomorrow', no questions asked. They are mainly Scottish people who just do not identify as