2014 Yes Vote by Local Authority Area National Identity
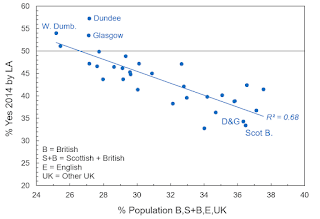
Plot of % Yes in 2014 for different local authority areas based on the % of respective populations nationally self identifying as British, Scottish + British, English and Other UK (Census 2011).
Unsurprisingly, the more British/other UK identifying a LA population was, the lower the Yes vote in 2014. Of course conversely, the more Scottish and less British/UKish an LA area is, the more it voted in favour of independence.


