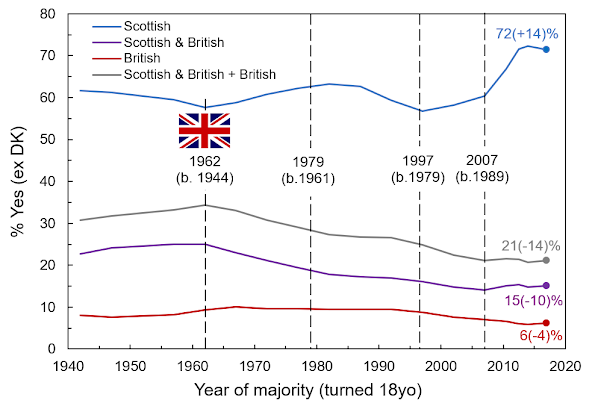
Scottish Free Choice Self Declared National Identity / Nationality as a Function of Year of Majority
Graph of Scottish free choice self declared national identity / nationality as a function of year of majority (YoM) i.e. the year a person turned 18. Selected YoM with corresponding years of birth (b, in brackets) are shown.
British identity in the Scottish population peaks in those born in 1944, i.e. the post war consensus baby boomers, these people turning 18 early in the swinging sixties (1962).
Britishness then goes into continuous decline while Scottish (only) identity remains relatively stable in those who turned 18 in the intervening years until ~1997 onwards when it starts to rise measurably, with a corresponding acceleration in the decline of Britishness. This is the generation turning 18 in the year of the 1997 devolution referendum, i.e. ‘Thatcher’s children’, born in 1979.
2007 sees a huge surge in Scottish identity in new 18 year old voters. These are the young Scots coming of age under pro-independence devolved governments.
These trends are fundamentally linked to the ~60 year rise in support for devolution (52%, 1969 -> 74% 1997) then independence (45%, 2014 -> 50.2% 2021). They are both a cause and a symptom of this, just like the rise in support for pro-indepdence parties, namely in the form of the SNP and Greens.
The SNP got 2.4% of the vote in 1964, and have been in ascendency since, albeit with ups and downs.
To undo this process, you need to undo 60 years of UK, European and world history.
https://en.wikipedia.org/wiki/Elections_in_Scotland#1964
Data from the 2011 census.


